
What's the ROI for Dynamic LED Grow Lights in a Commercial Greenhouse
What's the ROI for Dynamic LED Grow Lights in a Commercial Greenhouse.
What’s the Real Payback Period for Dynamic LED Grow Lights in a Commercial Greenhouse?
Commercial greenhouse operators evaluate lighting upgrades the same way they evaluate any capital investment—by the numbers. How many months until the system pays for itself? What return does it deliver over five years? These questions drive the decision, and the answers depend on which costs and gains you include in the calculation.
Most payback estimates for LED grow lights focus on a single variable: energy savings over HPS. That calculation captures part of the picture. It misses two additional revenue drivers that dynamic LED systems deliver—yield and quality improvements, and operational flexibility across crop zones. This article breaks down all three layers so you can build a realistic payback estimate for your operation.
Why Payback Period Matters More Than Upfront Cost
How Commercial Growers Calculate Lighting ROI
Payback period measures how long a capital investment takes to recover its cost through savings and additional revenue. The formula is straightforward: divide the net investment (capital cost minus rebates) by the estimated annual cash flow gain (energy savings plus incremental revenue minus incremental operating costs).
A grower who invests $400,000 in a lighting retrofit and gains $120,000 per year in combined savings and revenue hits payback in 3.3 years. That same grower recovers $600,000 over five years—a 150% return on investment.
The critical variable in this equation is the denominator. If you count only energy savings, the annual gain looks smaller and the payback stretches longer. If you include yield improvements, quality premiums, and reduced maintenance, the annual gain increases and the payback compresses. The most accurate ROI calculation captures every measurable financial impact the lighting system creates. Dynamic LED systems generate gains across more categories than static LED fixtures, which changes the payback math significantly.
CapEx, OpEx, and Hidden Savings: Three Cost Layers
Capital expenditure covers fixture hardware, installation labor, and electrical infrastructure. Operational expenditure includes electricity, lamp replacement, and HVAC adjustments. Hidden savings include reduced cooling loads from lower heat output, fewer crop losses from environmental stress, and labor savings from automated light management.
HPS systems convert only about 34% of input energy into visible light—the rest dissipates as heat and non-photosynthetically active radiation, according to data published by P.L. Light Systems. This excess heat forces HVAC systems to work harder, increases water consumption through higher transpiration rates, and creates temperature inconsistencies across growing zones. Dynamic LED fixtures convert more energy into photosynthetically active radiation and produce less waste heat. The HVAC and water savings compound over every operating hour.
-compressed.jpeg)
Energy Savings: The First ROI Driver
Static LED vs. Dynamic LED Energy Performance
Static LED fixtures deliver a fixed spectrum at a set intensity. They consume less electricity than HPS systems per micromole of light output, and most commercial growers see a 35–50% reduction in lighting electricity after a one-for-one HPS-to-static-LED swap. Research from the U.S. Department of Energy confirms that LED adoption in horticultural applications can cut lighting energy use by 50% compared to high-pressure sodium.
Dynamic LED systems add a second layer of savings on top of that baseline. They adjust spectrum and intensity in real time based on ambient sunlight conditions, crop growth stage, and recipe targets. When cloud cover breaks and natural light floods the greenhouse, a dynamic system dims automatically. When a crop moves from vegetative growth into flowering, the system shifts spectrum without manual intervention. These adjustments eliminate energy waste from over-lighting—a cost that static fixtures cannot avoid because they lack real-time ambient light integration.
How Real-Time Spectral Compensation Cuts kWh Per Kilogram
Spectral compensation means the lighting system reads current ambient light conditions and supplies only the missing wavelengths and intensity needed to hit the daily light integral (DLI) target for that crop zone. On a bright afternoon in July, the system may operate at 15% capacity. On a dark January morning, it ramps to full output. The result: every kilowatt-hour produces maximum photosynthetic value.
Sollum Technologies’ grower partners have documented a 56.8% reduction in lighting energy costs using this approach—a composite figure that combines 40% savings over HPS with an additional 16.8% gained through dynamic spectral compensation beyond what static LED fixtures deliver. The Cornell-led GLASE consortium—a partnership between Cornell University and Rensselaer Polytechnic Institute funded by NYSERDA—targets a 70% reduction in greenhouse lighting electricity through an integrated system that combines LED control with CO₂ management, ventilation, and humidity optimization. These benchmarks exceed what any static LED fixture can achieve, because static systems lack the sensor feedback and cloud platform needed to modulate output dynamically throughout the day.
Yield and Quality Gains: The Biggest ROI Accelerator
Case Study Results from Commercial Greenhouse Operations
Energy savings reduce costs. Yield and quality gains increase revenue. In most payback models, the revenue side of the equation has a larger financial impact than the cost side—yet most growers underweight it when evaluating lighting investments.
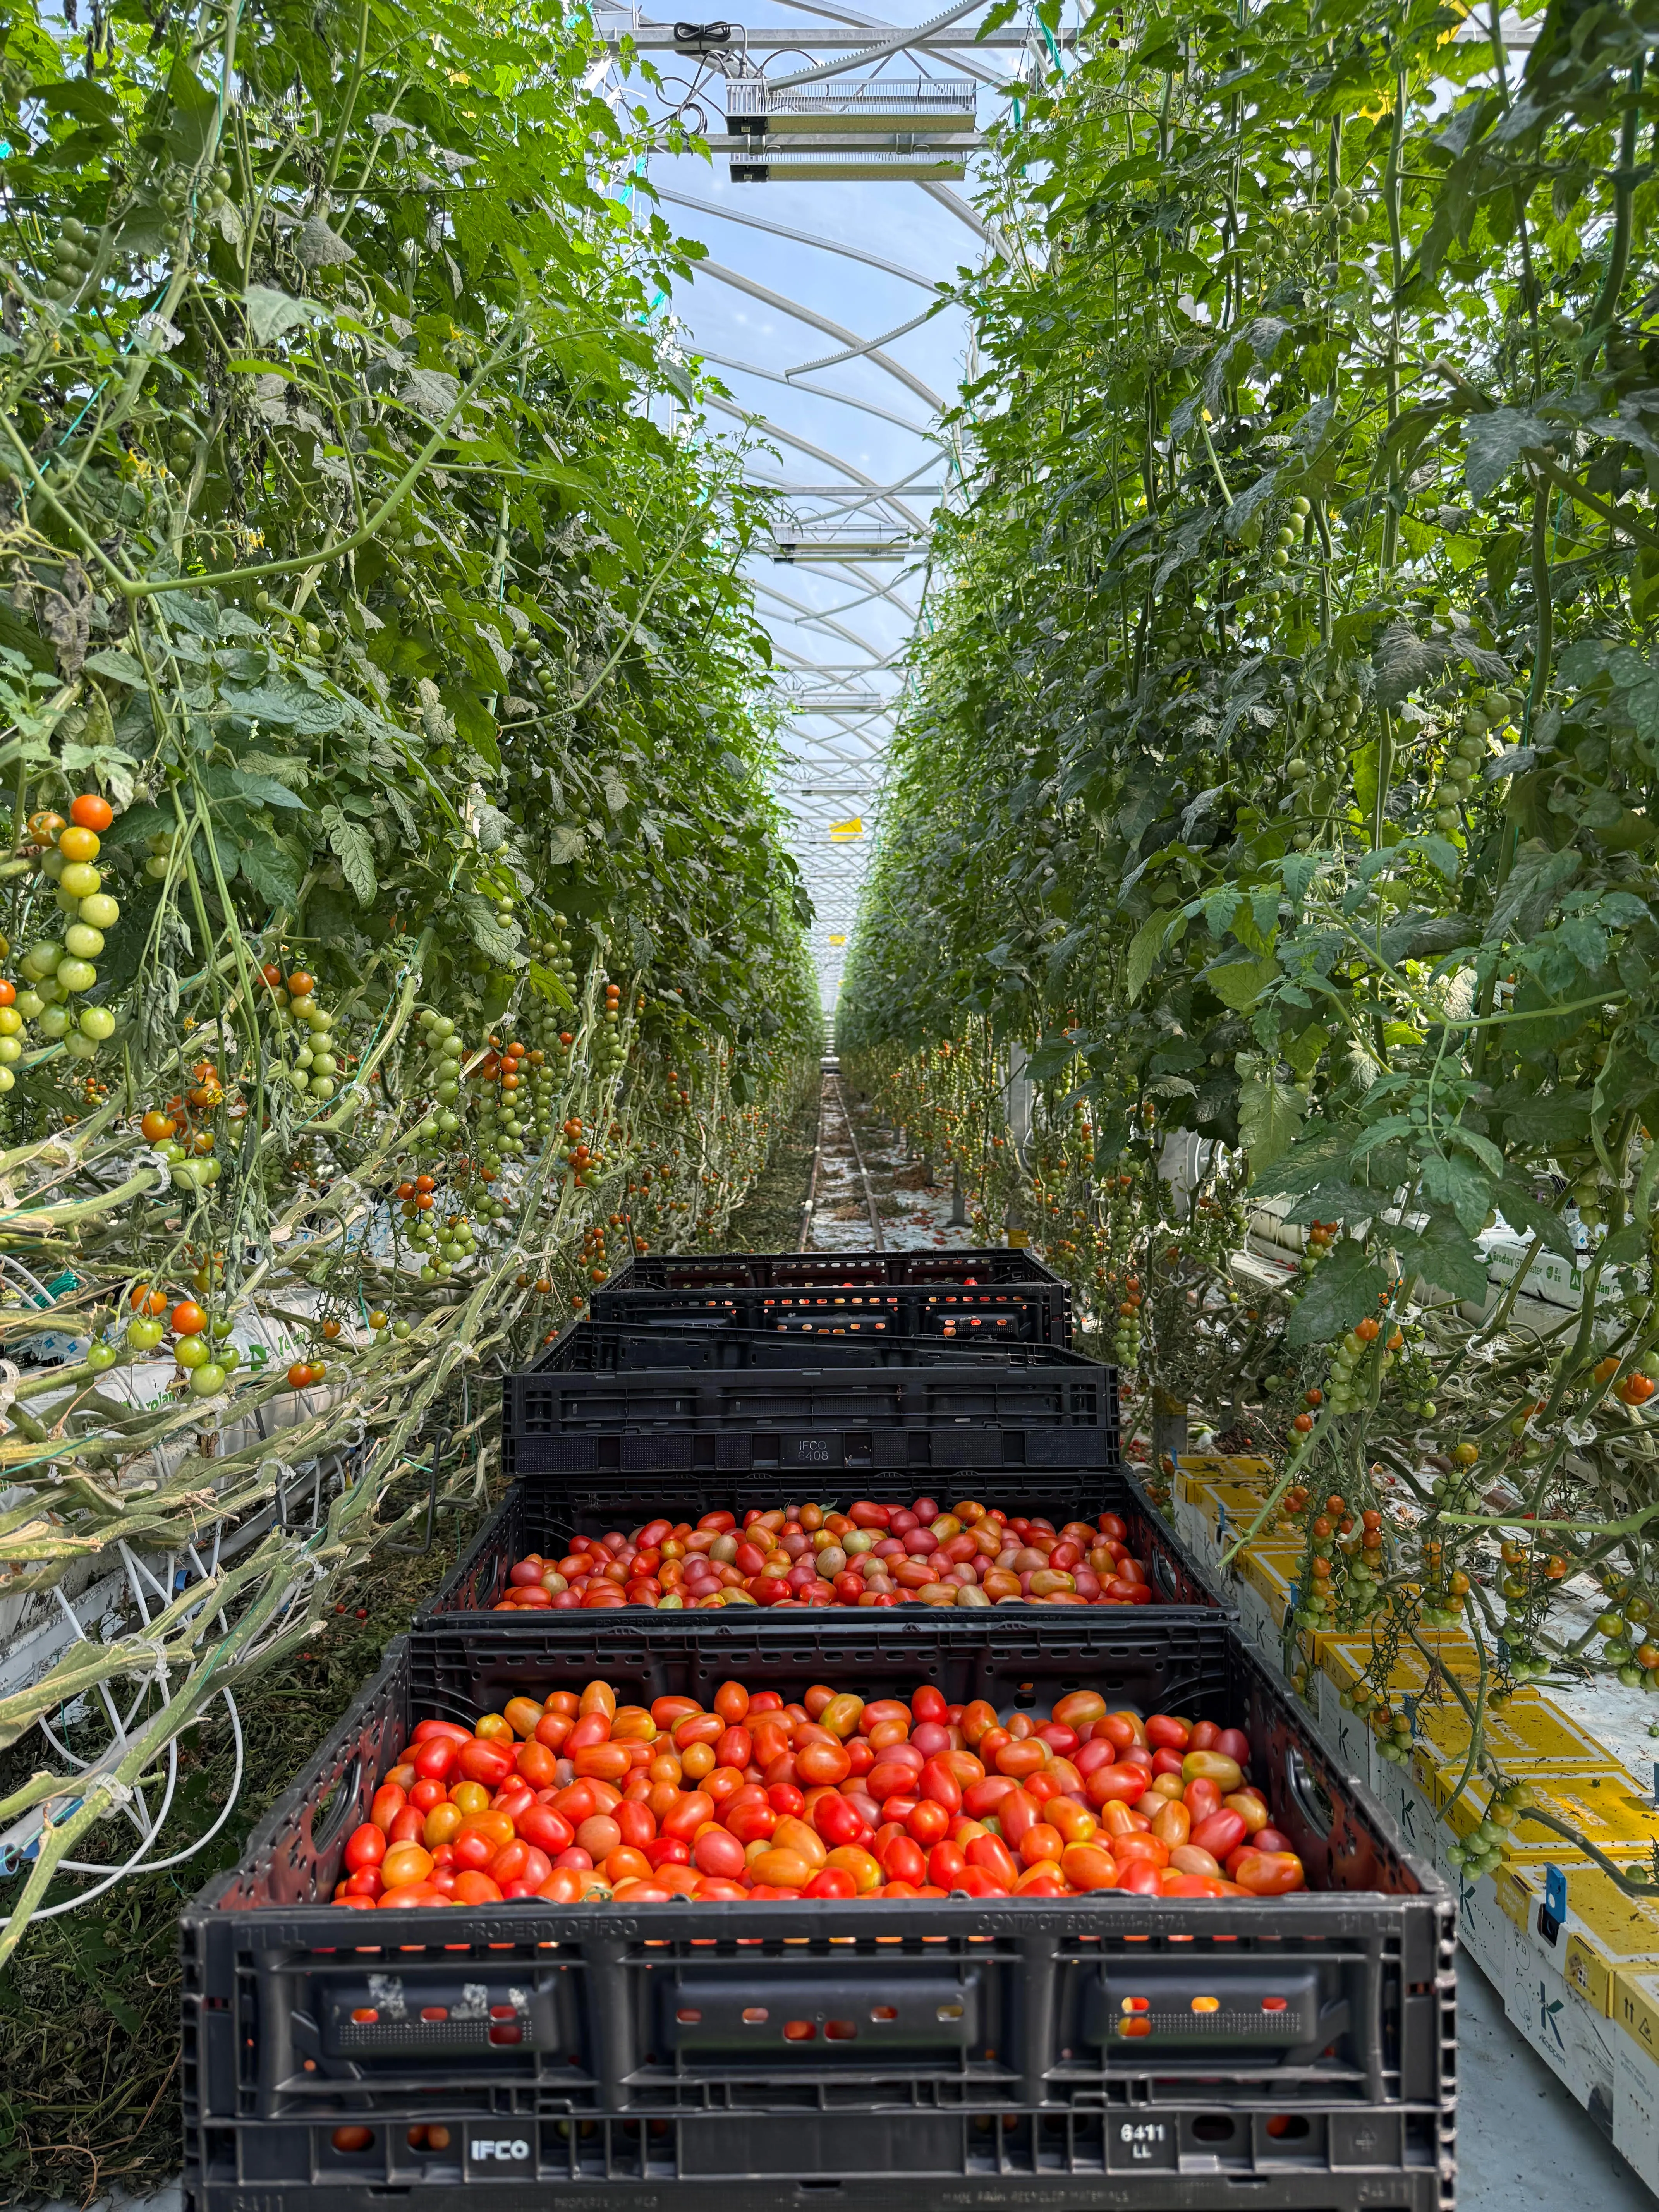
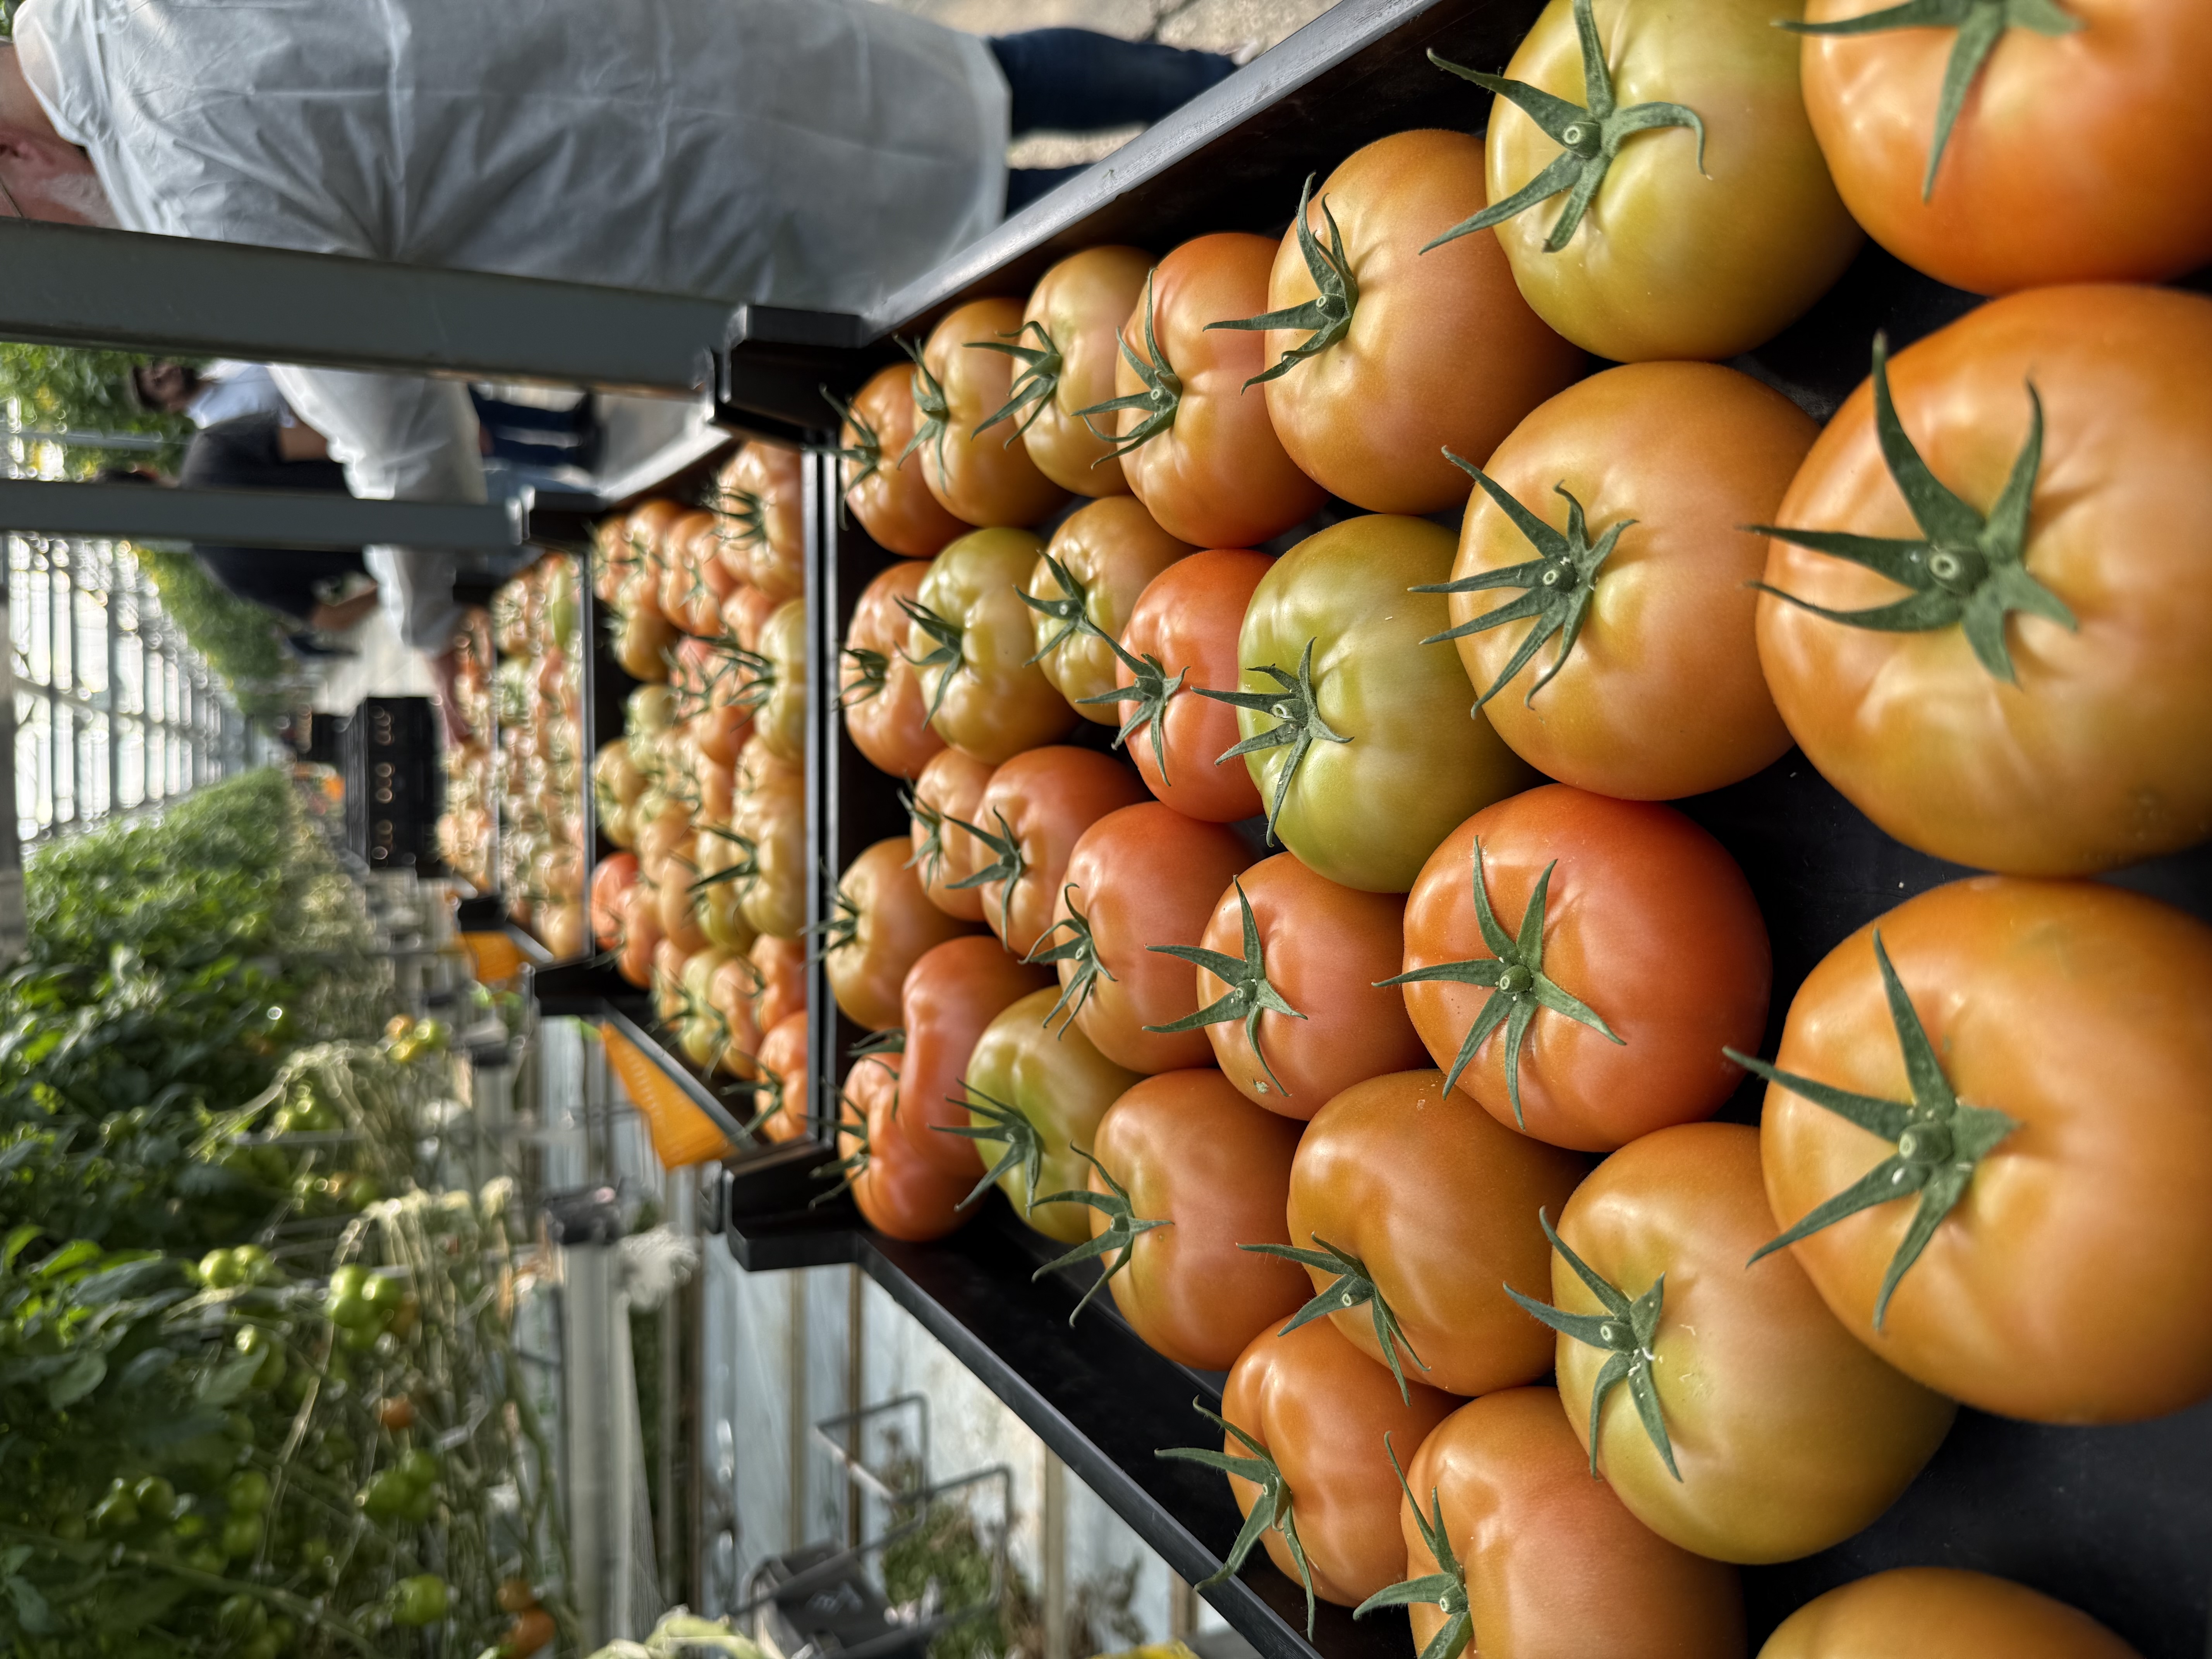
Sollum’s commercial installations have produced measurable crop performance improvements across multiple species. Tomato operations using Sollum’s dynamic LED grow lights and the SUN as a Service® (SUNaaS®) platform recorded up to 19.5% higher yield versus broad-spectrum static LED, in a 22-week commercial grape tomato trial in Ontario. Grower trials with LED grow lights for strawberries saw Class I fruit quality rise by 54%—a shift that directly increases revenue per square meter because premium-grade product commands higher wholesale prices.
Research conducted through Sollum’s partnerships with organizations including Berger and Lafayette College confirms these patterns across additional crop categories including peppers, eggplant, and specialty herbs. Wageningen University and Research trials have also demonstrated that LED-grown crops can produce higher biomass and better post-harvest quality than HPS-grown equivalents for certain cultivars. When you add a 15–20% revenue gain to the denominator of the payback equation alongside energy savings, the payback period compresses by one to two years for most mid-size greenhouse operations.
How Dynamic Spectrum Raises Grade-A Product Percentages
Fixed-spectrum lights deliver the same wavelength mix from seedling stage through harvest. Dynamic spectrum systems change the ratio of blue, red, far-red, and other wavelengths at each growth phase. This precision activates specific photoreceptors—phytochrome for flowering induction, cryptochrome for stem elongation control—at the right time.
The outcome is more uniform crop development, fewer culls, and a higher percentage of Grade A product per harvest cycle. Growers who sell into retail channels where appearance and shelf life determine price capture immediate financial benefit from this shift.
Operational Flexibility: The ROI Layer Most Growers Overlook
Multi-Zone Crop Rotation Without Infrastructure Changes
Static lighting systems lock a greenhouse into one light recipe. If you grow tomatoes under a fixed red-heavy spectrum and want to rotate into leafy greens or herbs, you need different fixtures or filters—both require capital and downtime.
Sollum’s SUNaaS cloud platform enables multi-zone light management within the same facility. Each zone runs its own light recipe simultaneously. A grower can produce tomatoes in zone one, lettuce in zone two, and propagation-stage ornamentals in zone three—all under the same fixture hardware. This capability eliminates retrofit costs when crop plans change, shortens the transition between seasonal rotations, and opens revenue from higher-margin specialty crops without additional infrastructure investment. No static LED system on the market offers this level of zone-by-zone recipe control.
Utility Rebates That Shorten Payback
DLC Certification and North American Rebate Programs
The DesignLights Consortium (DLC) certifies horticultural LED fixtures that meet strict efficacy and quality standards. DLC-listed products qualify for prescriptive and custom rebates from utility companies across the United States and Canada. These rebates reduce the upfront capital cost—the numerator in the payback equation—by thousands of dollars per fixture.
Sollum’s dynamic LED grow lights carry DLC certification. Canadian programs in British Columbia, Ontario, Quebec, and Saskatchewan offer rebates ranging from $40 to $1,000 per fixture depending on facility type. Select U.S. utility programs cover a significant portion of lighting equipment costs—and in some cases, the full amount. Sollum provides end-to-end rebate application support to streamline the process. For a full breakdown of available programs, read about
LED lighting rebates for greenhouse growers.
How to Build Your Payback Estimate and Take the Next Step
Five Inputs Every Grower Needs Before Comparing Systems
A reliable payback estimate requires five data points from your current operation: total annual lighting electricity cost (kWh and dollar amount), current fixture wattage and daily operating hours, crop yield per square meter and Grade A percentage, HVAC costs attributable to lighting heat load, and current lamp replacement frequency and labor cost.
With these inputs, you can model the financial impact of a dynamic LED retrofit across all three ROI layers—energy, yield, and operational flexibility. You can also calculate how utility rebates reduce your net capital outlay. Growers who already track these metrics through their climate computer or energy management system can generate an accurate payback estimate within a single consultation.
Request a Custom ROI Assessment for Your Greenhouse
Every greenhouse has different electricity rates, crop mixes, operating hours, and infrastructure constraints. A generic payback calculator cannot account for these variables. Sollum’s team builds custom ROI assessments that model energy savings, yield projections, rebate eligibility, and multi-zone flexibility gains specific to your facility.
Sollum Technologies—winner of Deloitte’s Technology Fast 50 Award and the Greenhouse Technology Award—has helped commercial growers across North America quantify the financial return of dynamic LED lighting. Request your custom ROI assessment today and see the real payback period for your operation.
Learn about the new energy savings feature
About Sollum Technologies
As the leader in advanced dynamic LED lighting for commercial greenhouses, Sollum Technologies offers a unique proposition. The comprehensive solution provides the flexibility to adapt lighting in real time to meet crop needs at every stage of growth, supports producers operational and financial goals in a sustainable manner, and offers unmatched technical and agronomic guidance. Designed and manufactured in North America, Sollum's technology is deployed across major greenhouse operations to support year-round production, consistent quality, and smarter energy use.
Founded in 2015, Sollum is headquartered in Montréal (Québec, Canada) with regional offices in Kingsville (Ontario, Canada) and Atlanta (Georgia, USA). For more information, visit sollum.tech.

Stay informed on growing
Get the latest news, innovations, and insights delivered to your inbox
